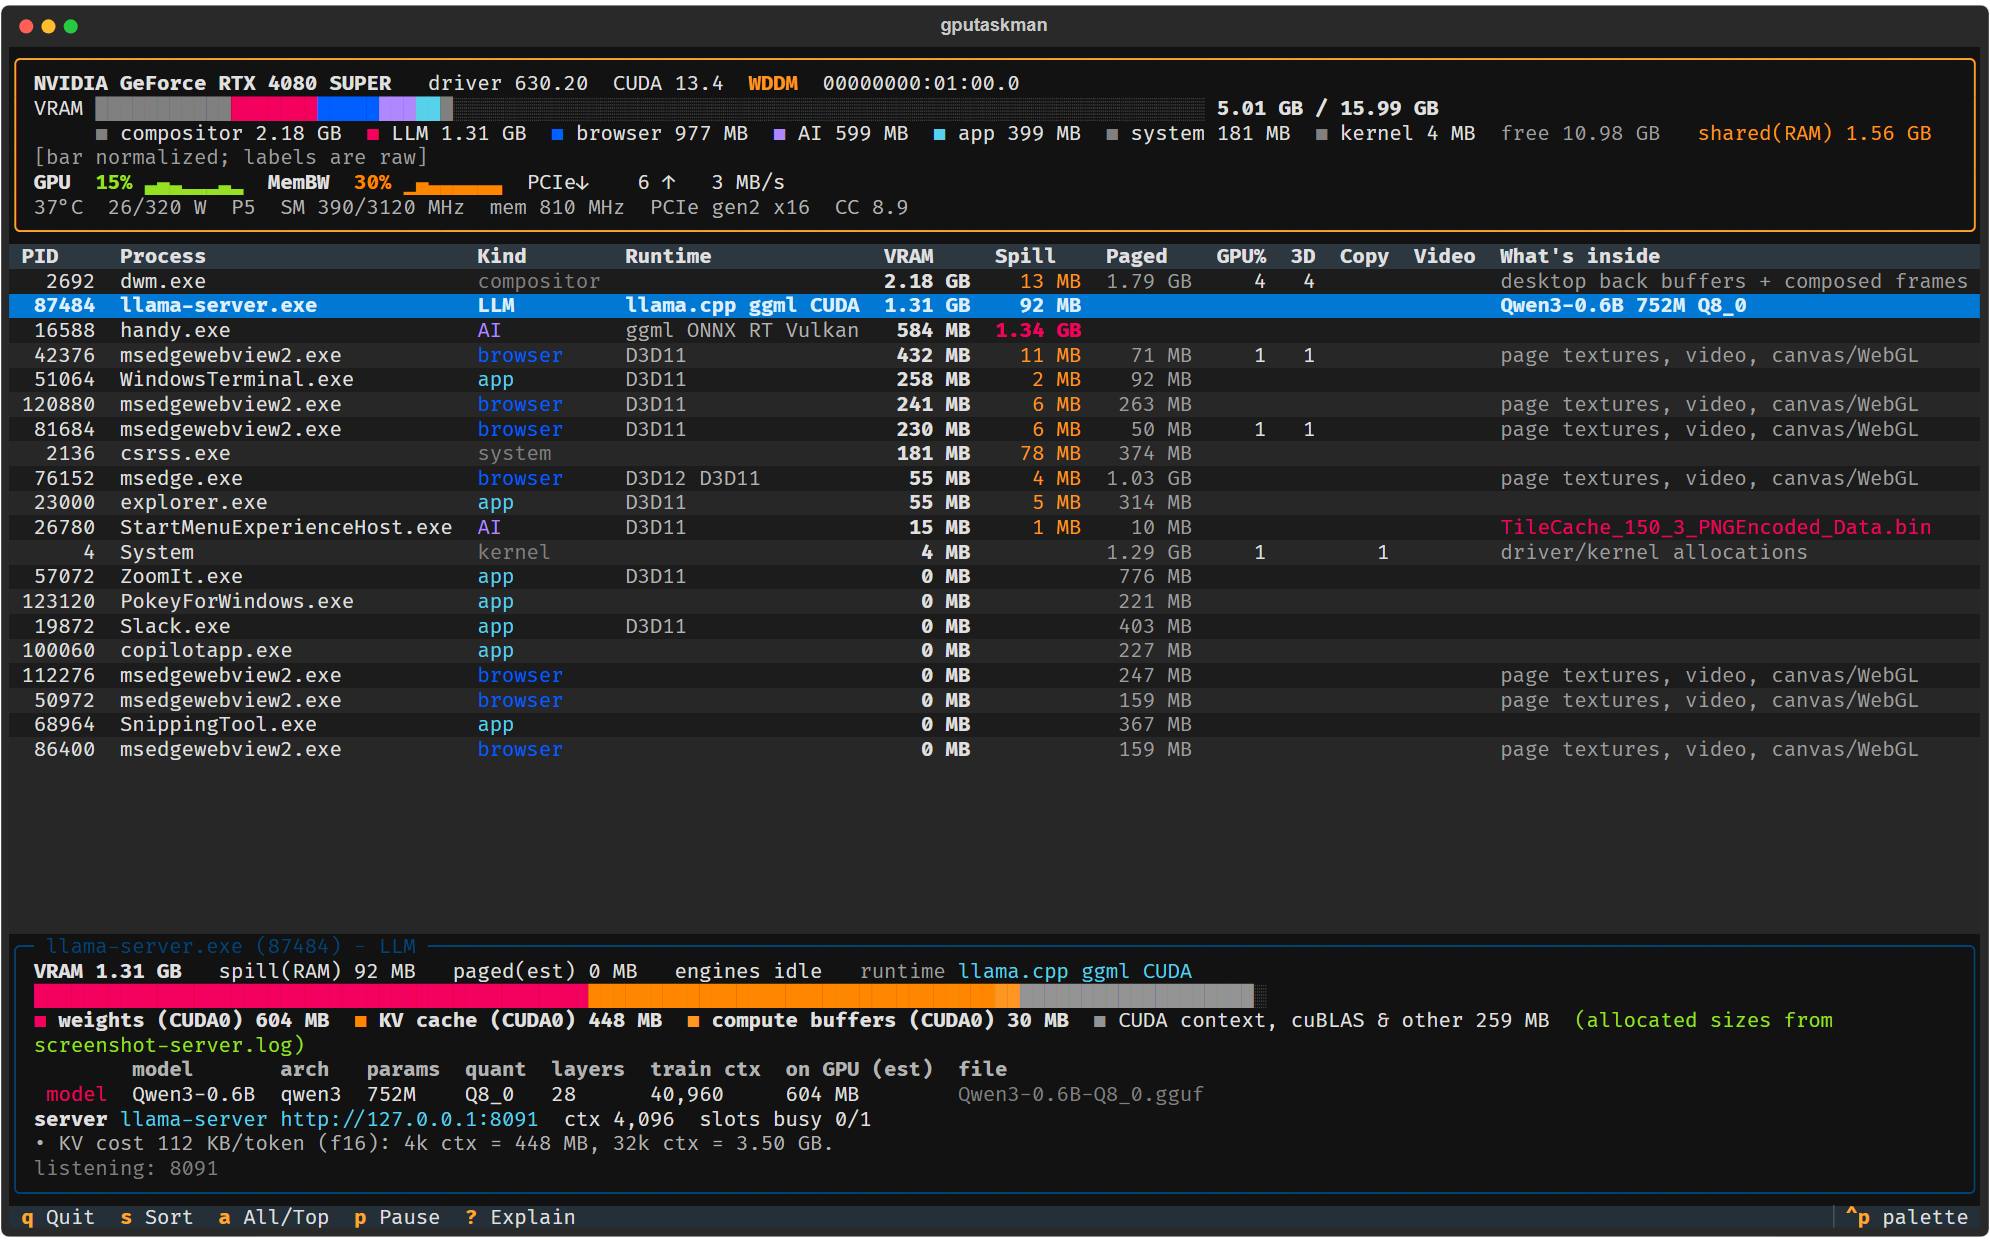
When a local model runs out of GPU memory, the total allocation alone may not explain where the space went. gputaskman, an experimental MIT-licensed project by Scott Hanselman, is a terminal monitor that brings per-process GPU counters together with available clues about runtimes and model files.
The project describes Windows, Linux and WSL support, with readings that depend on the operating system, GPU and driver. Its 0.3.5 package release was published November 10; the repository has continued to evolve since then. The screenshot shown here comes from the project’s own example workload and is not a benchmark by OpenSourceCoder.com.
Measurements and estimates
The interface can show device activity and process memory where supported, then associate visible processes with runtimes, model files and possible language-model components. The project is explicit that device and process counters are measurements while model classifications and GGUF-derived breakdowns can be estimates. Seeing a mapped model file does not by itself prove that it is resident on the GPU or actively generating.
On native Linux, the documentation describes NVIDIA process counters via NVML, with other backends subject to driver support. WSL has different visibility: matching Linux processes to Windows-host counters depends on interop and may be uncertain, while per-process engine load for WSL Linux rows is unavailable. Users should treat an unavailable value as unknown rather than zero.
Useful for local AI work
A monitor like this can help a developer identify browser, compositor or model-server usage while investigating memory pressure. It cannot enumerate everything inside GPU memory, and hardware support varies. The OpenSourceCoder.com repository profile points to the project source and its current documentation.
Normal inspection and JSON output can contain process names, paths, command-line flags and local ports. Review and redact captures before sharing them. We have reviewed the project documentation but have not installed or tested the tool on our hardware.
EXPLORE THE SOURCE
Projects in this story
GitHub repositories
- shanselman/gputaskman ↗View project details
Original reporting from linked project documentation; no independent installation or test.